tishaa14
Bangladesh

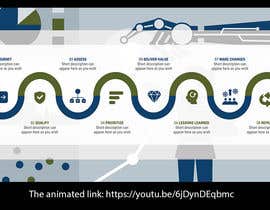
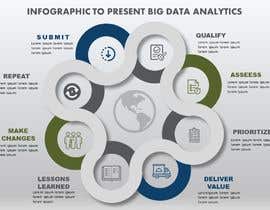
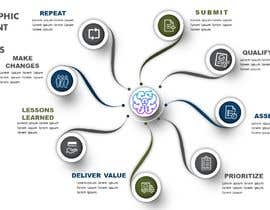
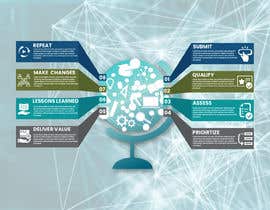
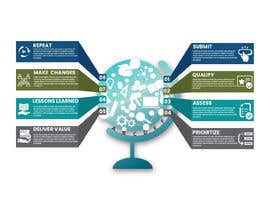
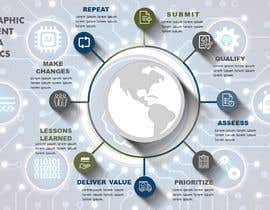
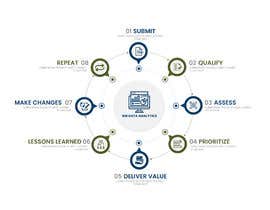
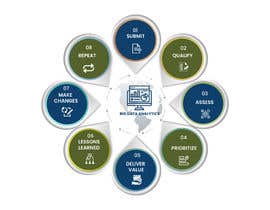
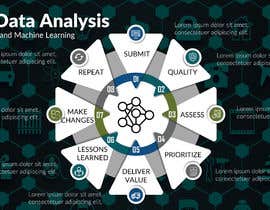
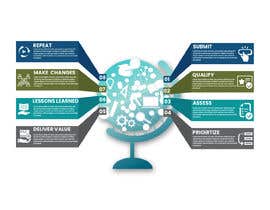
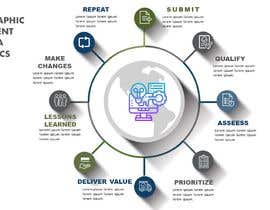
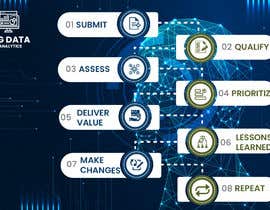
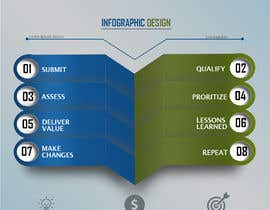
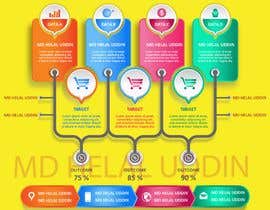
I need an editable info graphic (Could be power point, or anything else) that represents A data AND big data analytics demand process. Should have some sort of analytics machine learning, internet of things (Smart devices and artificial intelligence ) theme on it. SHOULD be SIMPLE yet IMPACTFUL: Steps are:
1. Submit (minor description)
2. Qualify (minor description)
3. Assess (minor description)
4. Prioritize (minor description)
5. Deliver Value (minor description) - would be need if this has a speed and agility theme
6. Lessons Learned (minor description)
7. Make Changes (minor description) _ this needs to point to a visual of a central team with build as you go concept)
8. Repeat (minor description)
It would be great to have 4 versions of this:
1. one with description included
2. one with no description included
3. One animated
4. One Non-Animated
RGB Colors we would like to use are:
Dark BLUE: 14, 64, 106
Dark GREEN: 85, 98, 43
Charcoal: 85, 87 89
Need in editable powerpoint, and need in PHP, PSD, AI, GIF, JPEG formats also
“Thank you Julius! Excellent work”
![]() samiadg, Canada.
samiadg, Canada.


Publica tu concurso Fácil y rápido

Consigue toneladas de propuestas De todo el mundo

Elige la mejor propuesta ¡Descarga fácilmente los archivos!